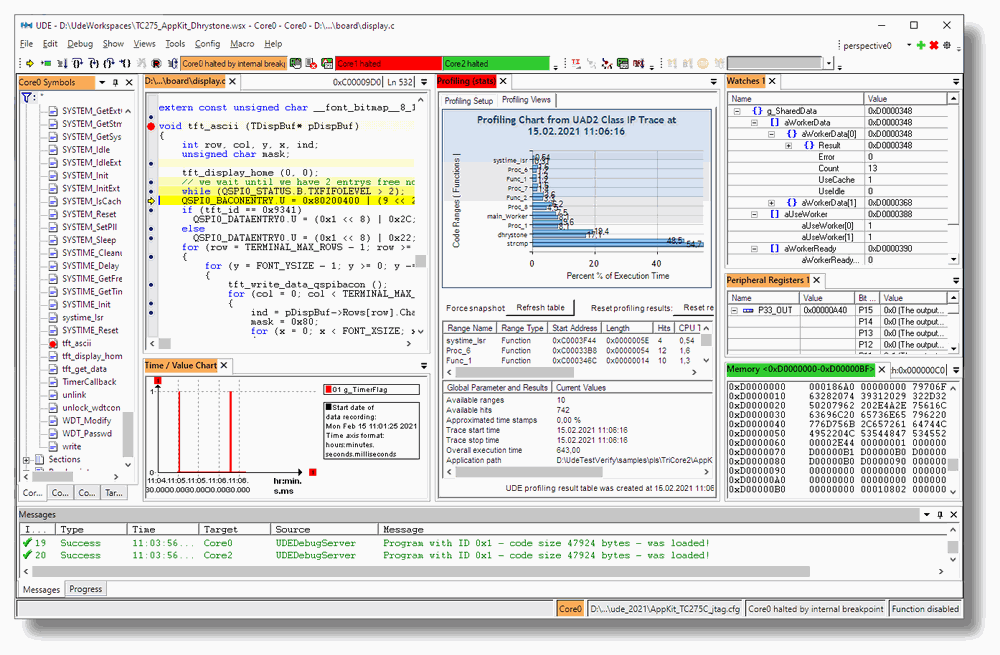
The UDE Universal Debug Engine® is a powerful tool for debugging, testing and system analysis. The UDE combines comprehensive functions for debugging, trace and runtime analysis with intuitive and efficient use. UDE’s fundamental functions comprise C/C++ and assembler debugging, real-time monitoring, system visualization and system analysis. Additionally, the UDE provides extensive capabilities for test automation, in-system FLASH programming, support for a wide range of real-time operating systems as well as AUTOSAR software development, and more. The UDE supports a wide range of multicore SoCs and microcontroller families from ST.
UDE enables efficient and convenient control and monitoring of multi-core architectures within a single common user interface. The tool allows synchronized debugging (simultaneous stop, single step and restart of software execution running on different cores) of homogeneous and heterogeneous multicore systems including special cores (e.g. GTM, HSM, eTPU, PPU and others). Users can configure multi-core debug synchronization very flexibly and according to their requirements:
- Multi-Core Run Control Manager for synchronizing all cores, a selected set of cores or disable debug synchronization
- Multi-Core Breakpoints employed in shared code simplify debugging of complex applications.
- UDE Multi-Core / Multi-Program Loader takes care of loading program binary files into the various cores of the multicore system and manages the debug information that is used by the UDE.
UDE offers a modern and user-friendly user interface that provides a system centric view rather than a core centric view of the multicore system. The user interface allows a comprehensive and clear view of the entire system or, optionally, of selected parts:
- Easy and fast creation of a debug session via a guided setup process
- Ready-to-start with preconfigured target configurations for a large number of evaluation boards
- UDE Target Manager provides an overall view to the multicore system as well as central functions for run-control
- Core specific colors for windows and toolbar controls to highlight their core association
- Convenient window management allows the debugger session to be adapted to the preferences of the user (e.g. docked windows, floating windows, multi-screen operation)
- »Perspectives« feature to focus on selected cores

| Supported Devices | Stellar MCUs (ARM R52),SPC57,SPC58,SPC5 |
| Tool Type | Debugger,Performance,Programming Tool |
| License Type | Commercial |
| Site |
